





North Atlantic Surface Pressure Charts
Produced by the NOAA Ocean Prediction Center • Surface analysis updated every 6 hours • All times UTC
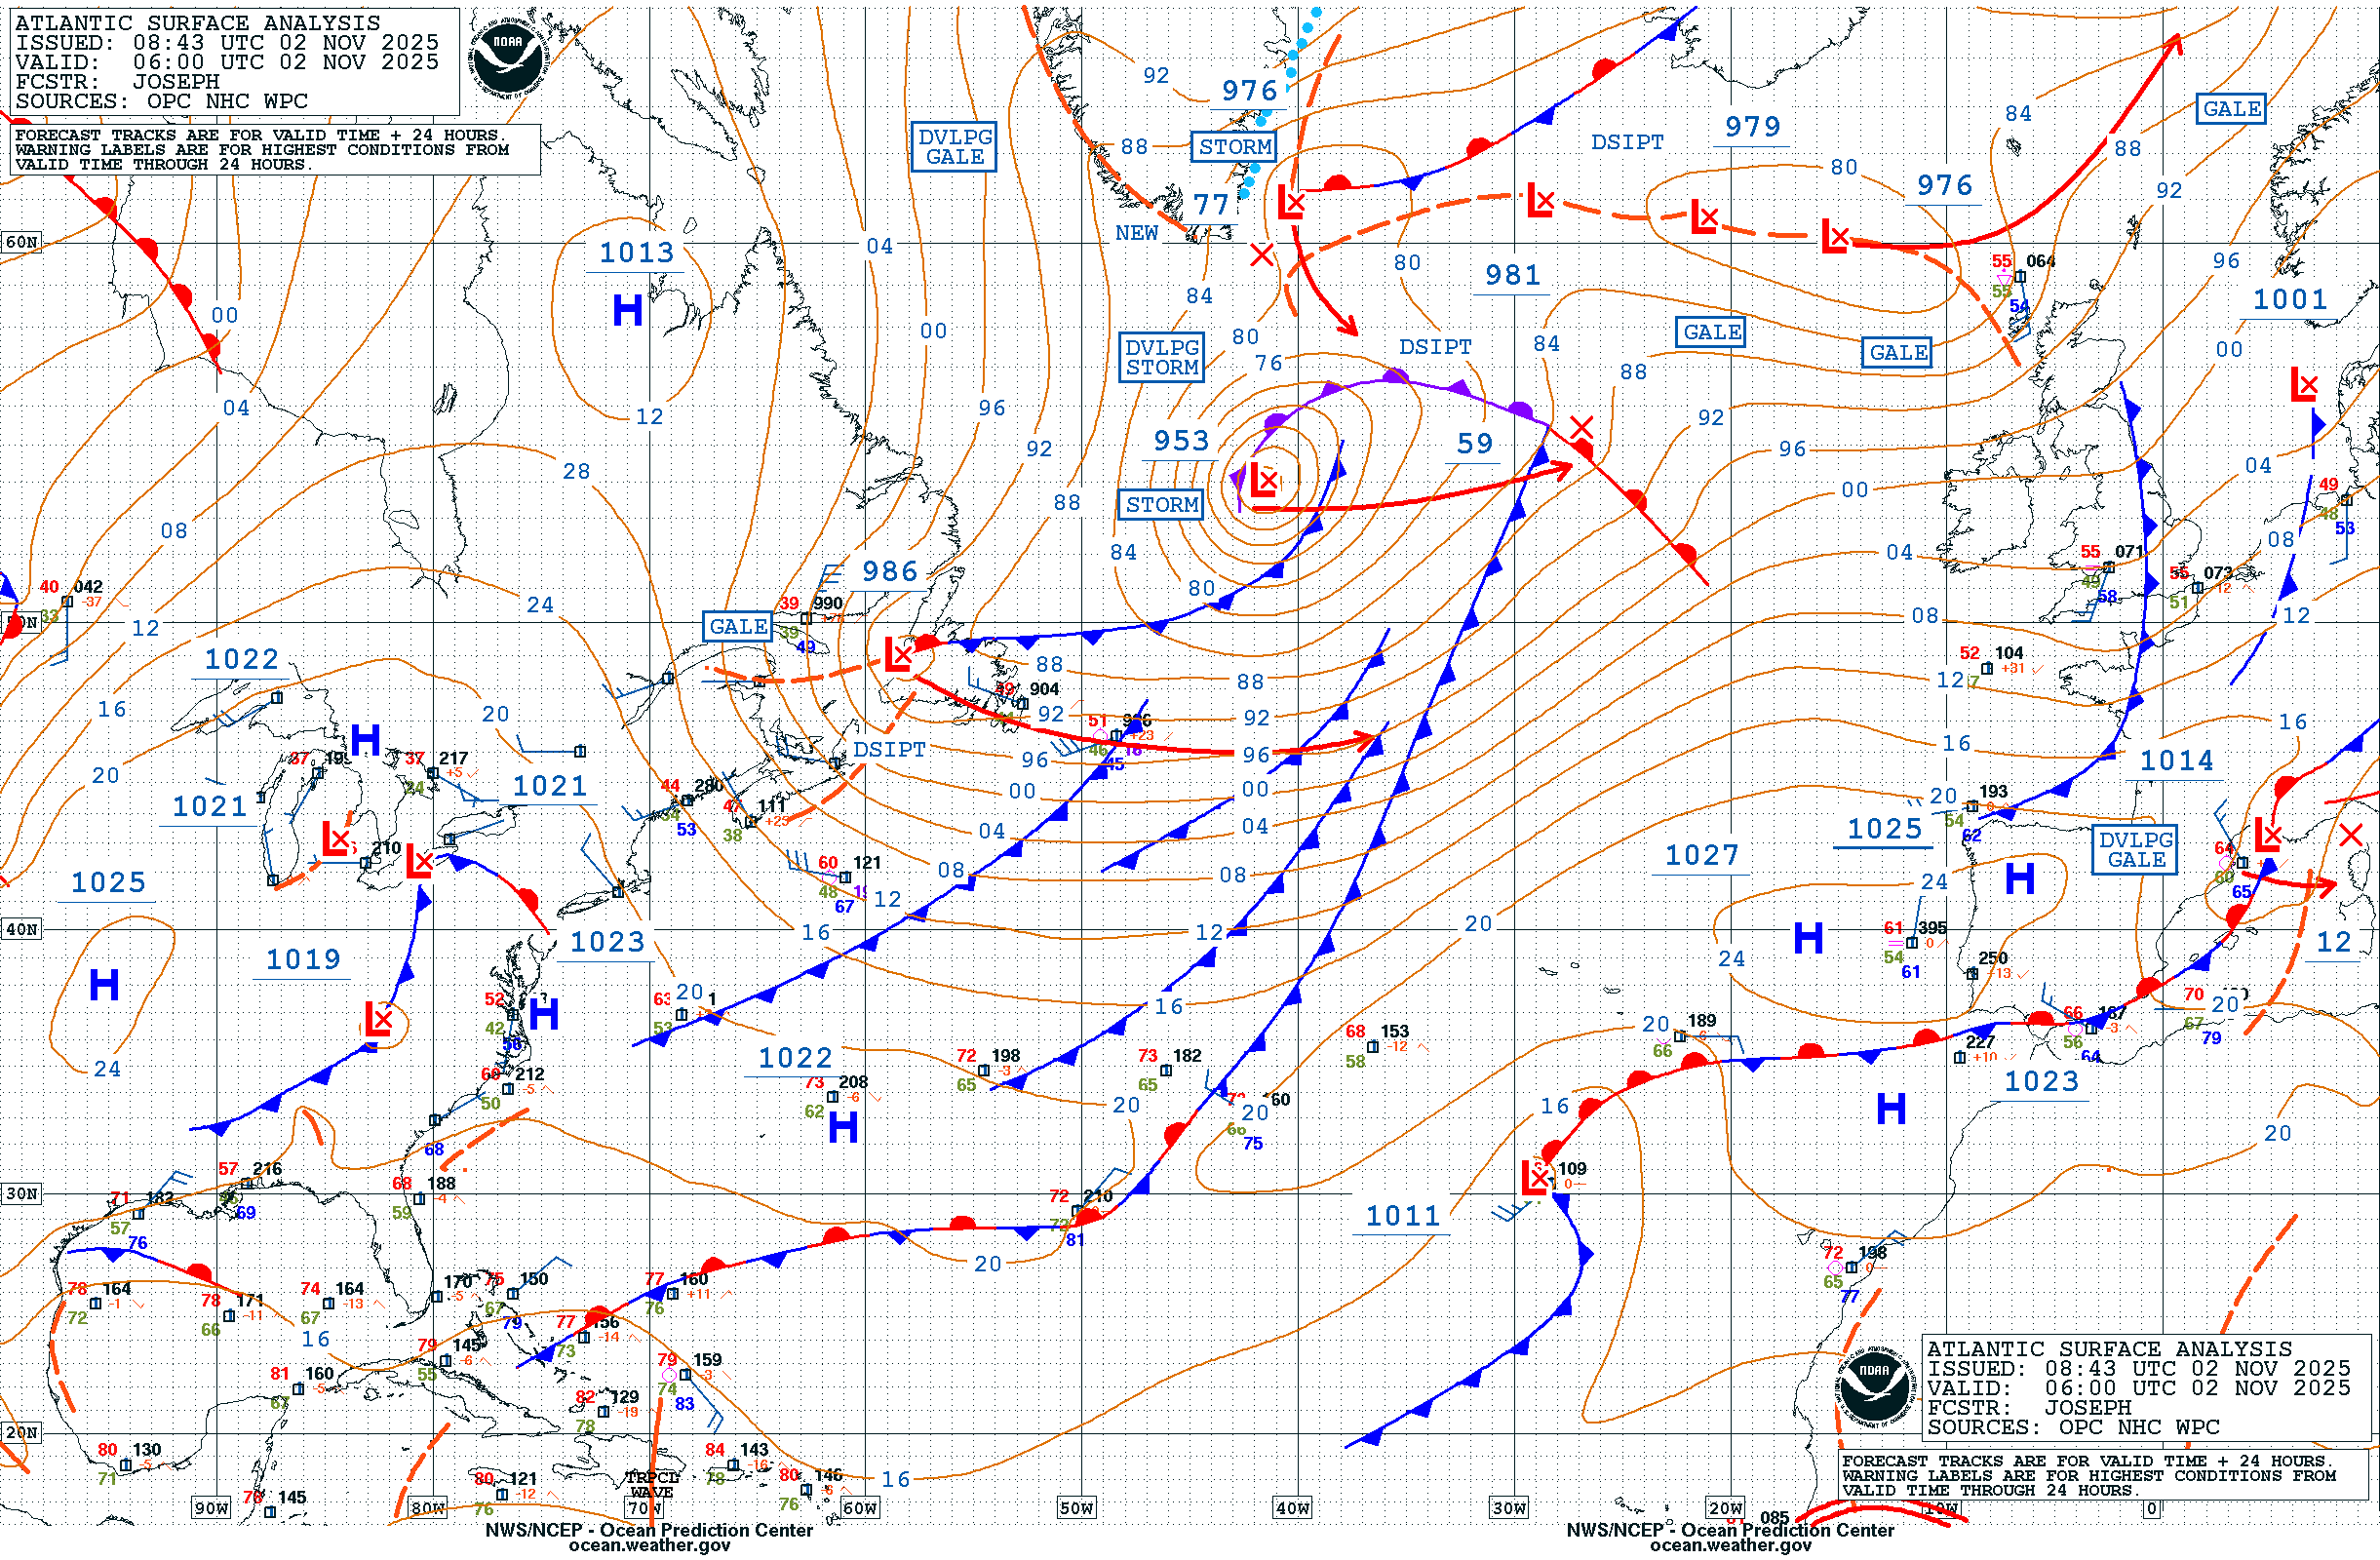
Almost all of the UK’s weather originates in the North Atlantic. These charts show the pressure systems, weather fronts and winds that will reach us over the coming days. Understanding what is out over the ocean now tells you a great deal about what Southampton can expect in the next 24–96 hours.
Surface Pressure & Fronts
Isobar charts showing pressure patterns and weather fronts across the North Atlantic. Select a time period:
Source: NOAA Ocean Prediction Center
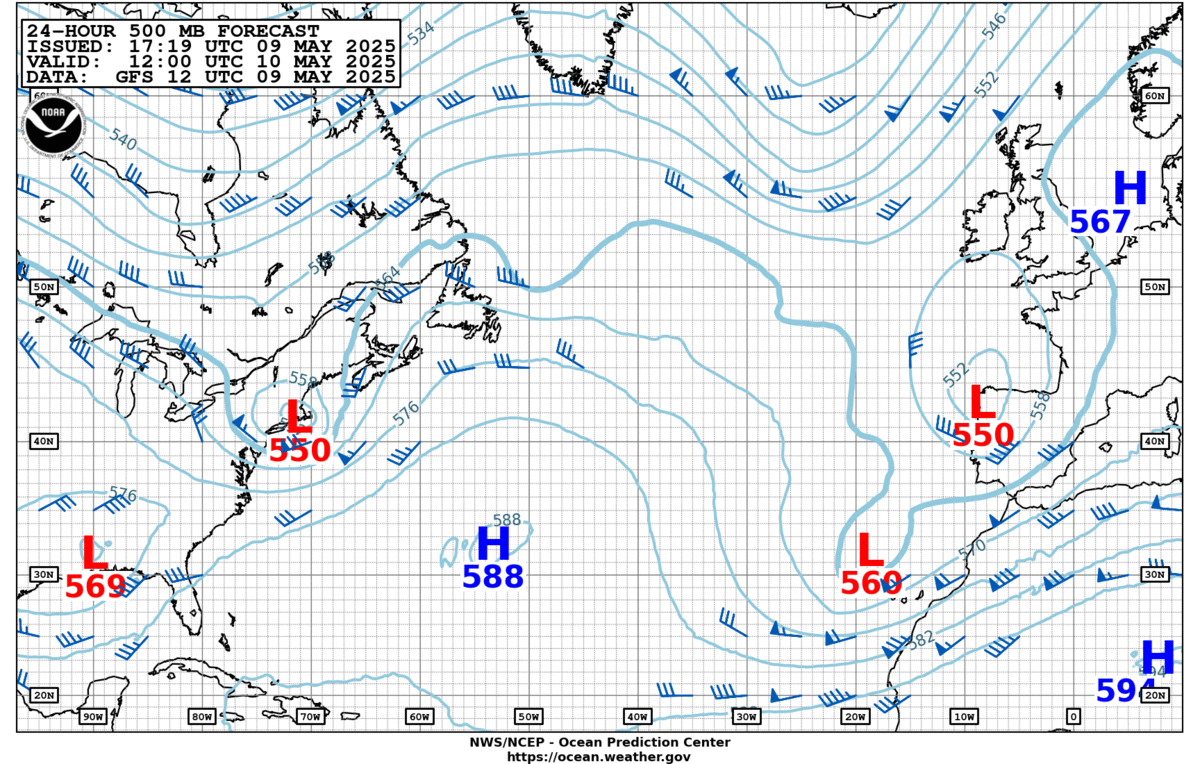
500mb Upper Air Charts
These charts show conditions at around 5,500 metres altitude — roughly the middle of the troposphere. The pattern of high and low heights at this level reveals the position of the jet stream and the large-scale steering flow that determines where surface weather systems will track. A persistent trough (dip) in the 500mb pattern over the Atlantic almost always means low pressure and unsettled weather for the UK.
Source: NOAA Ocean Prediction Center
How to Read a Synoptic Chart
|
Isobars are the curved lines joining points of equal atmospheric pressure, measured in millibars (mb) or hectopascals (hPa) — the two are identical. They are drawn at 4 mb intervals. The closer together the isobars, the steeper the pressure gradient and the stronger the wind. Widely spaced isobars indicate light winds. High pressure (H) — also called an anticyclone — brings settled, often dry weather. Winds circulate clockwise around a high in the northern hemisphere. In summer, highs bring warm sunny spells; in winter, they can bring fog and frost. Low pressure (L) — also called a depression or cyclone — is associated with cloud, wind and rain. Winds circulate anticlockwise around a low. Most of the UK’s unsettled weather arrives with Atlantic depressions tracking eastward across the chart. |
Cold fronts are shown as a blue line with triangular points, indicating the boundary where cold air is pushing in behind the system. Conditions ahead of a cold front are often warm and muggy; as the front passes, temperatures drop and skies clear rapidly. Cold fronts can produce heavy showers and squalls. Warm fronts are shown as a red line with semicircles, marking where warm air is advancing over colder air ahead of the depression. Warm fronts typically bring a long period of increasing cloud and steady rain before the temperature rises. Occluded fronts are shown as a purple line with alternating triangles and semicircles. They form when a cold front catches up with a warm front in a maturing depression. The weather associated with occlusions can be complex and varied. |
The pressure at sea level around the UK normally varies between about 970 mb and 1040 mb. A vigorous Atlantic depression tracking towards the UK might show central pressure of 960 mb or below, which would indicate very strong winds. A strong anticyclone might reach 1040 mb or higher. The standard “average” sea-level pressure is 1013 mb.
Charts: NOAA Ocean Prediction Center • These charts are in the public domain as a product of the US federal government.