





Heat Index — How Hot It Actually Feels
Air temperature alone doesn't tell you how hot a day actually feels on your skin — humidity does much of that work. The Heat Index (sometimes called the "apparent temperature", alongside wind chill's opposite-season equivalent) combines temperature and relative humidity into a single "feels like" figure, based on research by the American scientist R. G. Steadman into how the human body actually experiences combinations of heat and moisture. It works because your body's main cooling mechanism, sweat evaporating off your skin, gets steadily less effective as the surrounding air gets more humid: humid air is already closer to holding as much water vapour as it can, so sweat evaporates more slowly and carries away less heat, leaving the body feeling hotter than the thermometer alone suggests.
Why Humidity Changes Everything
At cooler temperatures, humidity barely affects how hot it feels — below around 20°C (68°F), the Heat Index effect is considered negligible whatever the humidity is doing. But the higher the temperature climbs, the less extra humidity it takes to push the felt temperature well above the actual reading. A classic illustration is comparing a humid coastal city with a dry desert one: at around 35°C with 75% humidity, the air can feel closer to 44°C, whereas the same 35°C reading in air with only 10-15% humidity can feel only a degree or two above the thermometer. Given sunshine, the humid location is often the one that actually feels hotter to stand in, even though both places recorded exactly the same air temperature.
Where Real Heatwaves Come From
The Heat Index only measures how existing heat and humidity feel together — it doesn't explain why a heatwave builds up in the first place. That's usually down to a large dome of high pressure parking itself over a region in the middle layers of the atmosphere, acting as a lid that traps warm air underneath and suppresses the clouds and rain that would otherwise let some heat escape. The longer the dome sits in place, the more the trapped air keeps warming day after day, which is why the most extreme Heat Index readings on record tend to come at the end of a prolonged, stuck weather pattern rather than a single hot afternoon.

The most extreme combination of heat and humidity ever recorded came at Dhahran, Saudi Arabia, on 8 July 2003: a dew point of 35°C (95°F) alongside a 42°C air temperature produced a calculated Heat Index of around 81°C (178°F) — so far beyond the normal chart range that it stands as something of a freak outlier rather than a typical reading. Conditions anywhere near that extreme leave the body's own cooling system completely overwhelmed: blood vessels near the skin widen to shed heat and sweat glands work flat out, but once the air is close to saturated, sweat simply can't evaporate fast enough to carry that heat away, whatever the body tries to do.
Heat Index Risk Categories
| Category | Heat Index | Possible Effects |
|---|---|---|
| Extreme Danger | 54°C or higher (130°F+) | Heat stroke or sunstroke likely |
| Danger | 41 - 54°C (105 - 129°F) | Sunstroke, cramps and/or heat exhaustion likely; heatstroke possible with prolonged exposure or activity |
| Extreme Caution | 32 - 41°C (90 - 105°F) | Sunstroke, cramps and/or heat exhaustion possible with prolonged exposure or activity |
| Caution | 27 - 32°C (80 - 90°F) | Fatigue possible with prolonged exposure or activity |
Shade values — direct sunshine can add a further 6-8°C (10-15°F) on top of these figures.
Full Heat Index Lookup Table
Cross-reference actual air temperature (down the left) against relative humidity (across the top) to find the felt "Heat Index" temperature, shown as °C with °F in brackets. Blank cells mean the combination either doesn't reliably occur or the Heat Index isn't considered meaningful at that combination.
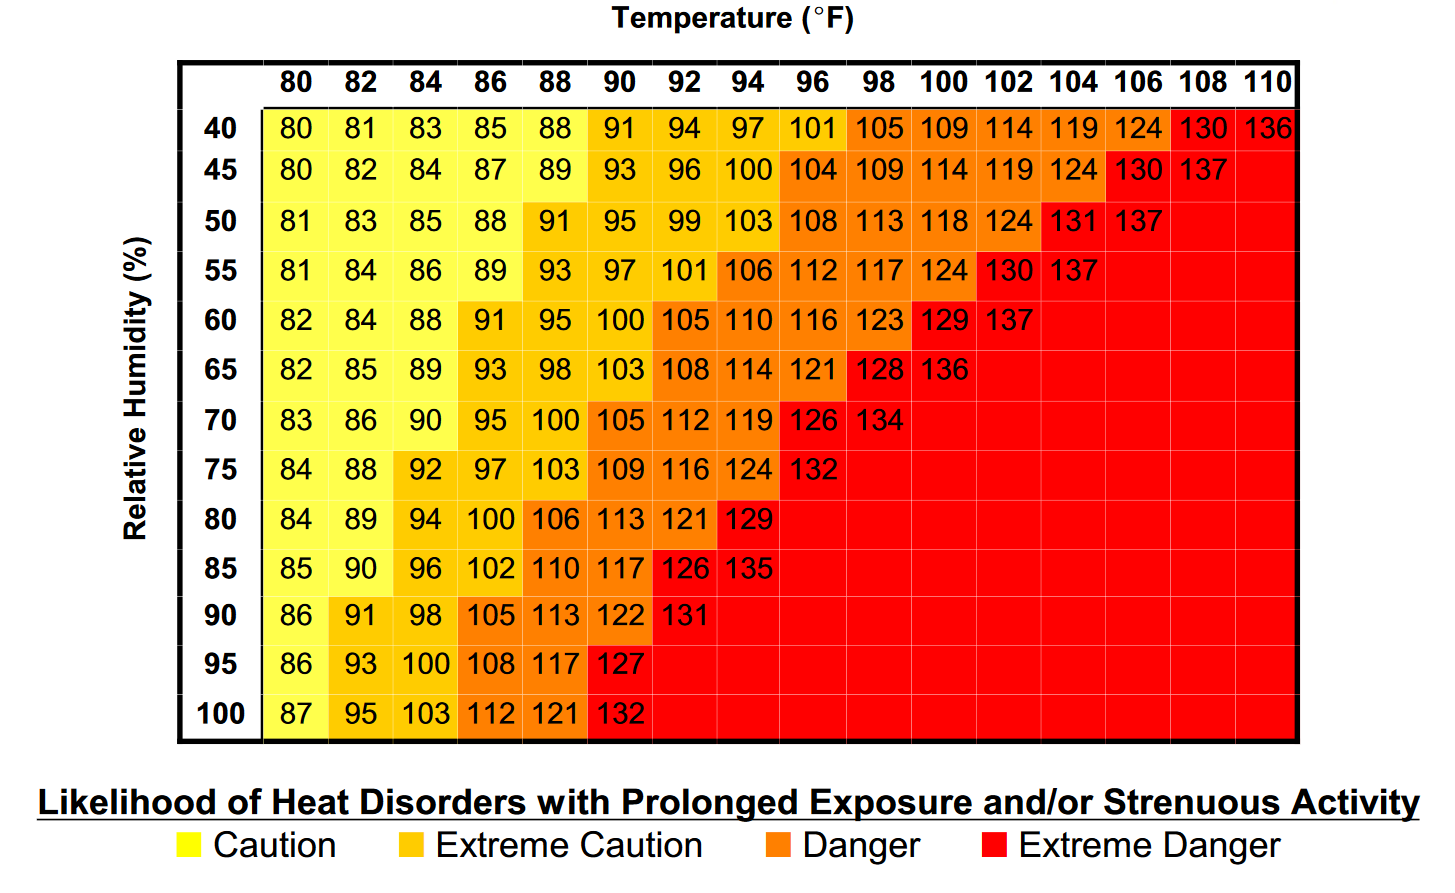
| Temp | 40% | 45% | 50% | 55% | 60% | 65% | 70% | 75% | 80% | 85% | 90% | 95% | 100% |
|---|---|---|---|---|---|---|---|---|---|---|---|---|---|
| 27°C (80°F) | 27(80) | 27(80) | 27(81) | 27(81) | 28(82) | 28(82) | 28(83) | 29(84) | 29(84) | 29(85) | 30(86) | 30(86) | 31(87) |
| 28°C (82°F) | 27(81) | 28(82) | 28(83) | 29(84) | 29(84) | 29(85) | 30(86) | 31(88) | 32(89) | 32(90) | 33(91) | 34(93) | 35(95) |
| 29°C (84°F) | 28(83) | 29(84) | 29(85) | 30(86) | 31(88) | 32(89) | 32(90) | 33(92) | 34(94) | 36(96) | 37(98) | 38(100) | 39(103) |
| 30°C (86°F) | 29(85) | 31(87) | 31(88) | 32(89) | 33(91) | 34(93) | 35(95) | 36(97) | 38(100) | 39(102) | 41(105) | 42(108) | 44(112) |
| 31°C (88°F) | 31(88) | 32(89) | 33(91) | 34(93) | 35(95) | 37(98) | 38(100) | 39(103) | 41(106) | 43(110) | 45(113) | 47(117) | 49(121) |
| 32°C (90°F) | 33(91) | 34(93) | 35(95) | 36(97) | 38(100) | 39(103) | 41(106) | 43(109) | 45(113) | 47(117) | 50(122) | 53(127) | 56(132) |
| 33°C (92°F) | 34(94) | 36(96) | 37(99) | 38(101) | 41(105) | 42(108) | 44(112) | 47(116) | 49(121) | 52(126) | 55(131) | — | — |
| 34°C (94°F) | 36(97) | 38(100) | 39(103) | 41(106) | 43(110) | 46(114) | 48(119) | 51(124) | 54(129) | 57(135) | — | — | — |
| 36°C (96°F) | 38(101) | 40(104) | 42(108) | 44(112) | 47(116) | 49(121) | 52(126) | 56(132) | — | — | — | — | — |
| 37°C (98°F) | 41(105) | 43(109) | 45(113) | 47(117) | 51(123) | 53(128) | 57(134) | — | — | — | — | — | — |
| 38°C (100°F) | 43(109) | 46(114) | 48(118) | 51(124) | 54(129) | 58(136) | — | — | — | — | — | — | — |
| 39°C (102°F) | 46(114) | 48(119) | 51(124) | 54(130) | 58(137) | — | — | — | — | — | — | — | — |
| 40°C (104°F) | 48(119) | 51(124) | 55(131) | 58(137) | — | — | — | — | — | — | — | — | — |
| 41°C (106°F) | 51(124) | 54(130) | 58(137) | — | — | — | — | — | — | — | — | — | — |
| 43°C (108°F) | 54(130) | 58(137) | — | — | — | — | — | — | — | — | — | — | — |
| 47°C (110°F) | 58(136) | — | — | — | — | — | — | — | — | — | — | — | — |
Heat Index in Southampton
Genuine Heat Index territory is rare here — the table above only really starts to diverge noticeably from the actual temperature once you're past the high 20s Celsius, and Southampton only reaches those readings on a handful of days most summers. When it does happen, it's usually during a spell of humid, thundery tropical-maritime air rather than the UK's more typical dry, sunny heatwave pattern, which is exactly the combination — heat plus humidity — that pushes the felt temperature furthest above the thermometer reading. On those days, the table above is worth checking alongside our Highs, Lows and Averages page.